Dashboards are used for a variety of data to provide a quick, graphical view of report information for budgetary, investigative, compliance, and other process improvement purposes.
To access Dashboards, go to .
| PERMISSION NAME | PERMISSION DESCRIPTION | CATEGORY |
| Dashboard - Share | Grants the ability to share a dashboard created by self with other users within the portal who may then view and refresh the results of the dashboard at-will. This permission works in conjunction with the Create Dashboard permission. | Reports - Dashboards |
| Dashboard - View |
Grants the ability to view dashboards created by self or shared by others. User must also have permission to view the standard, custom or Reporting 2.0 reports that are included in any shared dashboards. If a user does not have permission to view a report type, the user cannot view that report type within the dashboard. This is an end user permission. |
Reports - Dashboards |
Note: Access to a specific dashboard also requires permission to view the associated standard report. See Security Permissions.
What Is a Dashboard?
The term dashboard refers to a list of small reports which are all displayed on the same page. Dashboard reports are configurable to allow end-users, managers, and administrators to view summary information and are generally smaller in size and include graphs or charts. Users can configure their personal dashboard so that they can quickly view the information that is most important to them.
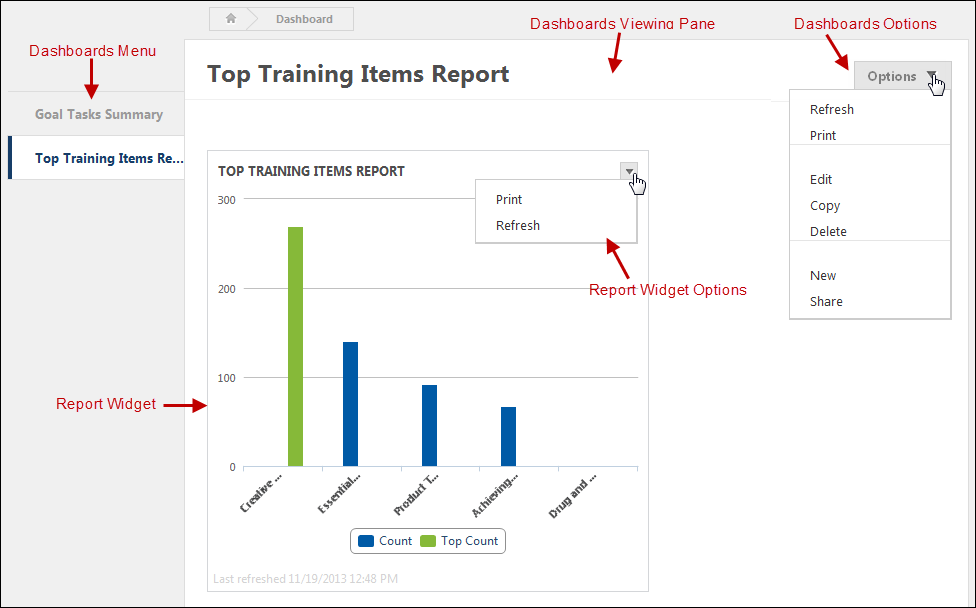
The Dashboards menu displays a list of dashboards that have been created by or shared with the user. The list provides a quick view of existing reports that can be accessed with one click. Each time a new dashboard is created, the dashboard is added to the menu in alphabetical order. Click the dashboard name to view the dashboard.
An Options drop-down displays in the upper-right corner with options to create, edit, copy, share, print, delete, and refresh the dashboard. See Dashboards - View Dashboards.
Dashboards display in a center viewing pane to the right of the Dashboards menu. The title of the dashboard appears at the top of the viewing pane. Each associated chart for the dashboard displays in the viewing pane with options to edit, print, delete, and refresh the report. See Dashboards - View Dashboards.
Each dashboard displays as a widget box that includes the dashboard chart and report data. See Dashboards - View Dashboards.
Each widget includes an Options menu. This menu only appears by hovering over the upper-right corner of the widget box. The options that are available are dependent upon the user's permissions. See Dashboards - View Dashboards.
How Many Dashboards Can I Create?
There is no limit to the number of dashboards you can create. When creating dashboards, you can add up to nine widgets to a dashboard.
Browser Compatibility
- This feature is compatible with all Cornerstone supported Internet browsers.
- The drag and drop feature on the Dashboards viewing panel is not compatible with IE7.
- This feature is not compatible with IE6, which is not a Cornerstone supported browser.
- This feature does not support IE browsers running in Compatibility mode.
Data Loading
Users will experience a slight delay in processing while the data for a dashboard loads.
Additional Dashboards Online Help Topics
- Add Dashboard - This topic explains how to add new report widgets to your dashboard.
- Copy Dashboard - This topic explains how to copy a dashboard.
- Dashboard Report Types - This topic lists the different dashboards that are available. Dashboards are available based on your standard report permissions.
- Edit/Copy Report Widget - This topic explains how to edit and copy a report widget.
- Edit Dashboard - This topic explains how to edit your dashboard, such as changing the dashboard title and description, as well as adding new widgets.
- Share Dashboard - This topic explains how to share your dashboard.
- View Dashboards - This topic explains the dashboard viewing pane, as well as the Options drop-down on the dashboard and the options available within an individual widget.
- View Report Data Details - This topic explains the View Details option, which displays in the options drop-down for each individual widget.
Dashboards in Reporting 2.0
Charts that are created for a report in Reporting 2.0 can be published as dashboards. See Reporting 2.0 - Publish to Dashboards.
You can find Reporting 2.0 widgets on the Reporting 2.0 tab in Dashboards. See Reporting 2.0 Widgets.
Recommended Reports
A complete list of recommended reports for managers, learning, performance, and succession is available in the OnDemand Support folder:
- See Recommended Standard Reports for Managers.
- See Recommended Standard Reports - Learning.
- See Recommended Standard Reports - Performance.
- See Recommended Standard Reports - Succession.
Frequently Asked Questions (FAQs)
The types of dashboards that are available to create can provide a snapshot of information about training, performance, succession, etc. However, some data is not available as a dashboard.
In such cases, you can leverage standard reports and Reporting 2.0 to create the output you are looking for. Standard reports provide pre-configured report options, and Reporting 2.0 lets you design the report yourself.
Dashboards are helpful to provide a quick, graphical view of report information for budgetary, investigative, compliance, and other process improvement purposes. For example, a dashboard may be created to determine if higher performance review scores versus compensation correlates to a higher completion of development plans each year.
While this information cannot be obtained from a dashboard, you can create a Reporting 2.0 report that will provide this information. The report can be scheduled to run daily, weekly, monthly, or once. The report creator can have the report sent to their email address. Further, you can share the report.