New dashboards can be added by users with permission to create dashboards. There is no limit to the number of dashboards you can create. When creating dashboards, you can add up to nine widgets to a dashboard.
To access Dashboards, go to .
| PERMISSION NAME | PERMISSION DESCRIPTION | CATEGORY |
Create a Dashboard
To create a dashboard:
- Click the New link in the Options drop-down in the upper-right corner of the Dashboards page. This opens the create dashboard page.
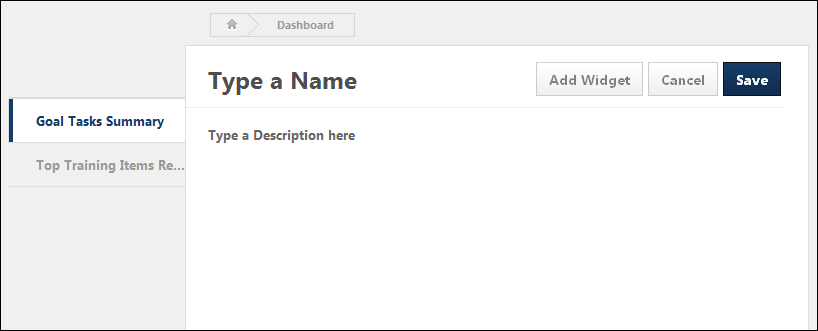
- Click anywhere in the Type a Name row to enter a title, up to 200 characters. This is a required field.
- Click anywhere in the Type a Description here row to enter a description, up to 500 characters. This is not a required field.
- Click the button. This opens the New widget page. This page displays the report widget categories that are available to the user based on the user's Reporting 2.0 permissions (Note: You must have permission to create the associated standard or Reporting 2.0 report in order to view and add the associated report widget. If you do not have the necessary permission, then the widget does not display. If you do not have permission to create any of the associated standard or Reporting 2.0 reports that are available for dashboards, then you cannot add any widgets.). The type of graphic in which the report data appears is displayed above the report name. The following are the possible graphics:
- Pie Chart -

- Horizontal Bar Graph -

- Vertical Bar Graph -

- Pie Chart -
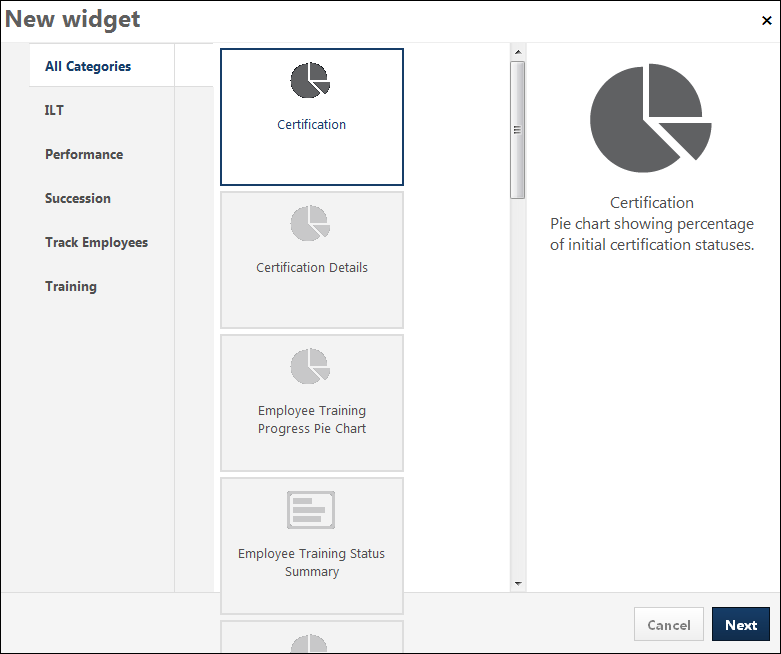
- Select the widget to add by clicking the associated widget box. The selected widget displays in the right panel, showing the graphic icon, report widget name, and a description of the data that the report widget displays.
- Click . This opens the report criteria pop-up. Note: The criteria that are available are dependent upon the report widget that you selected.
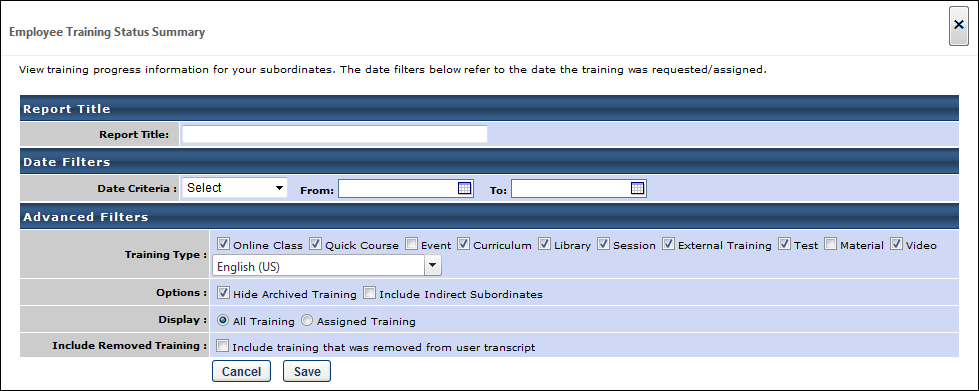
- Complete the criteria selections for the associated report widget. Note: Descriptions of the report criteria fields are available in each associated report topic in Online Help.
- Click to save the widget to the dashboard. Click to cancel adding the widget.
- Repeat the process to add more widgets. Up to nine widgets can be added.
Note: The maximum number of widgets in the dashboard cannot be changed.
Published Widget Category
The Published Widget category shows Reporting 2.0 reports that have been published as widgets.
For the Reporting 2.0 report creator, the Published Widget category is only available on the Dashboards page if the Publish to Dashboards option is selected on the Report Properties for the Reporting 2.0 report.
Re-Size Widgets
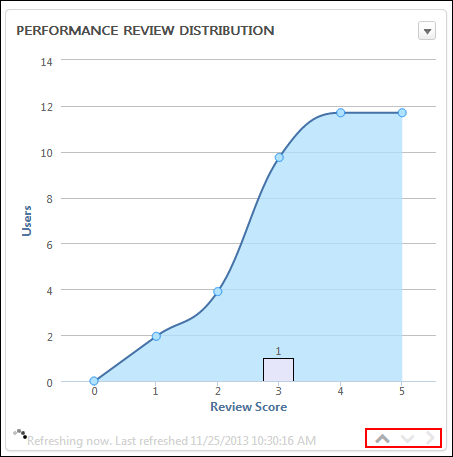
Each widget can be re-sized to improve the visibility of the chart and other data in the widget. To re-size a widget, click the expand icons in the lower-right corner of the widget. The maximize widget size is 500 x 500 pixels.
Reorder Widgets
The position of the widgets can be reordered by dragging and dropping the widget to the desired location on the dashboard.
Widgets cannot be dragged and dropped into a different dashboard.
Note: The functionality to reorder widgets using the drag and drop feature is not compatible with IE7.
Cancel/Save
Click to cancel creating the dashboard.
Click to save the dashboard.