Reporting 2.0 - Publish to Dashboards
Charts that are created for a report in Reporting 2.0 can be published as dashboards. Dashboards are used for a variety of data to provide a quick, graphical view of report information for budgetary, investigative, compliance, and other process improvement purposes. Being able to compare the reports in one view lets you perform discovery across the data and monitor information in real time.
The dashboard will be housed in the Reports > Dashboards area of your portal.
To access Reporting 2.0, go to
For more information about Reporting 2.0 permissions, see the following:
- Permissions in Reporting 2.0 - This provides detailed information about Reporting 2.0 permissions.
- Permissions List - This provides the list of permissions and their relationships so that you know which permissions users need to have to create and view reports.
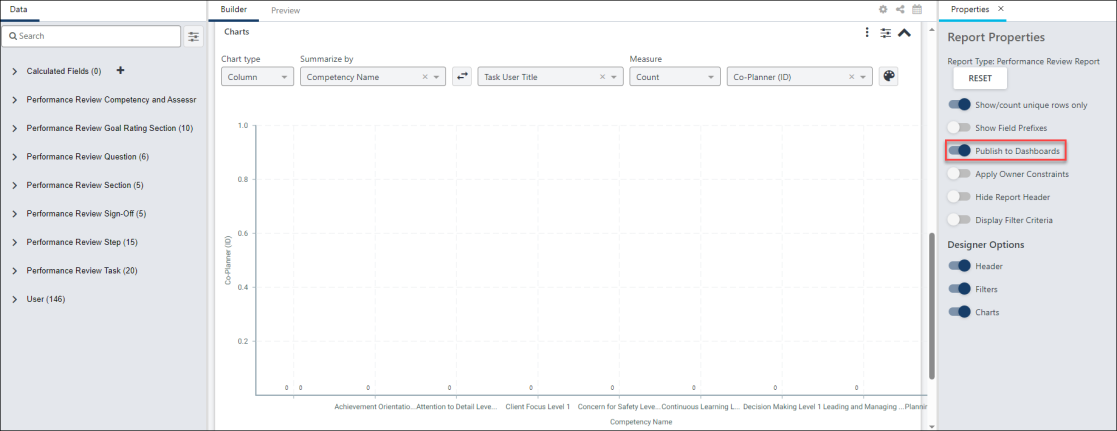
Publish Chart as Dashboard
To publish a chart as a dashboard:
- Create a chart for your report.
- Click the Show/Hide Report Options icon
 in the upper-right corner of the Builder tab, which opens the Report Properties panel.
 - Toggle the Publish to Dashboards option to On. This automatically adds the chart as a widget to the Reporting 2.0 tab in Dashboards.
To view the dashboard, go to . See Reporting 2.0 Widgets.
For more detailed information about dashboards, See Dashboard Reports Overview.
Reporting 2.0 Dashboard Use Cases
As an administrator or manager, there are many reasons you might want to create dashboards. The following are common use cases:
- Compliance - As a manager for a manufacturing company, I created a dashboard that shows me which workers are at risk for being unable to work due to compliance reasons.
- Remote Employees - My organization has high levels of serviced-based employees (e.g., healthcare, customer service, sales, billing, accounting), telecommuting has risen. As a policy-maker and Talent Management leader, I created dashboards to interpret the comparison between remote and non-remote workers so that I could understand who completes goals better, finishes compliance training faster, and is promoted more often.
- Performance Scores - As a member of the Talent Management team, I had numerous requests for reports that tell leadership which department has the highest percentage of positive performance scores. They also wanted to compare those numbers to total compensation and find out if higher performance vs. compensation correlated to a higher completion of development plans each year. I created a dashboard that provided this information and shared it with the leadership team.
- Hiring Sources - As a recruiter, I want to know which hiring sources are being used the most, as well as how those sources compare to performance for those new hires. I discovered that referrals are more efficient than external sources because they reduce the overall hiring cost and number of interviews, as well as increase the quality of candidates. I was also able to compare the data between hiring source and performance in different departments and determine how to encourage better hires in lower-performing areas.
- Compensation vs. Goal Completion - As a manager, I want to compare my team's current compensation with their progress toward year-end goals. I also want to compare the results to their succession task results. I want to use this information to help me make compensation recommendations to the Talent team during our performance review period.