When editing dashboards, an edit page opens from which the dashboard title and description can be modified, as well as the criteria for each widget. Additional widgets can also be added.
To edit a dashboard, click Edit from the Options drop-down in the upper-right corner of the dashboard.
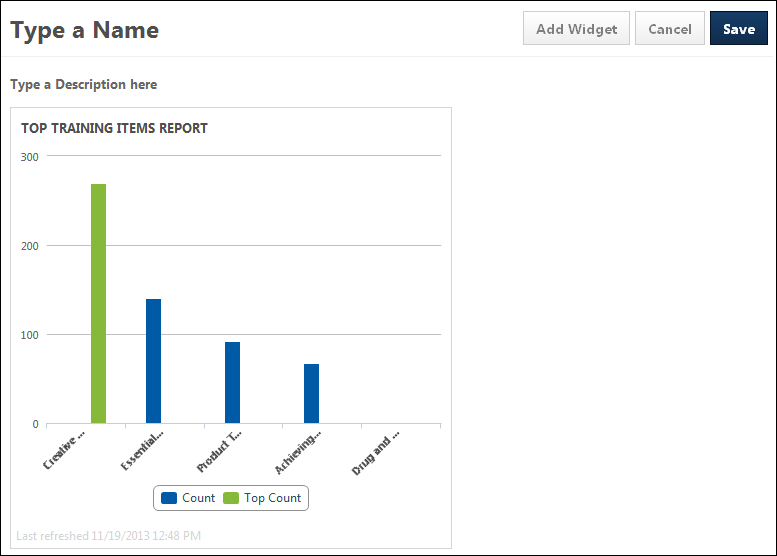
Change Dashboard Title
When in edit mode on the dashboard, the title of the dashboard can be changed. To change the title:
- Click anywhere in the title row. This opens the title in an editable text box.

- Enter the changes to the title. The field accepts up to 200 characters.
- Click to save the changes.
- Click to cancel the changes to the title.
Change Dashboard Description
When in edit mode on the dashboard, the description of the dashboard can be changed. To change the description:
- Click anywhere in the description row. This opens the description in an editable text box.

- Enter the changes to the description. The field accepts up to 500 characters.
- Click to save the changes.
- Click to cancel the changes to the description.
Note: If you have not yet added a description, then when you are editing the dashboard, the Type a Description here field displays. You can enter a description by clicking the field name.
Widget Criteria
The criteria for the widget can be modified by clicking the Edit link in the options menu for the report widget. This opens the Edit Widget pop-up, which displays the report criteria for the widget. Enter the changes, and then click . This closes the pop-up and updates the widget data.
Note: Descriptions of the report criteria fields are available in each associated report topic in Online Help.
Add Widget
To add a widget:
- Click the button. This opens the New widget page. This page displays the report widget categories that are available to the user based on the user's standard report permissions. The type of graphic in which the report data appears is displayed above the report name. The following are the possible graphics:
- Pie Chart -

- Horizontal Bar Graph -

- Vertical Bar Graph -

- Pie Chart -
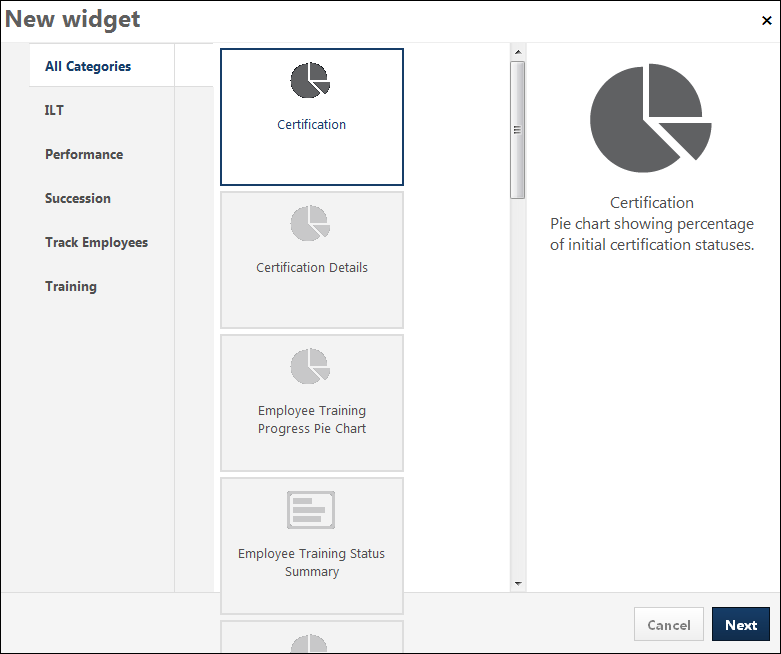
- Select the widget to add by clicking the associated widget box. The selected widget displays in the right panel, showing the graphic icon, report widget name, and a description of the data that the report widget displays.
- Click . This opens the report criteria pop-up.
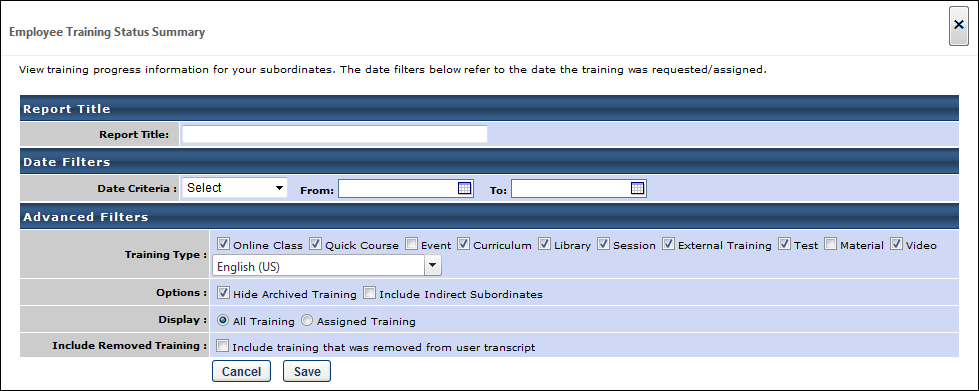
- Complete the criteria selections for the associated report widget. The criteria that are available to configure are dependent upon the type of report widget selected.
- Click to save the widget to the dashboard. Click to cancel adding the widget.
- Repeat the process to add more widgets. Up to nine widgets can be added.
Note: The maximum number of widgets that can be added can be changed by a backend setting. Contact Global Customer Support to modify this setting.
Cancel/Save
Click to cancel the changes to the dashboard.
Click to save the changes to the dashboard.