Reports are created by clicking the button on the Reporting homepage.
Note: Users who belong to the LXP_Admin and LXP_Manager groups can only create reports by using the System Templates.
Click here to download the list of Reporting 2.0 report types and field descriptions, updated May 17, 2024. This Excel spreadsheet provides descriptions for the report types and fields in Reporting 2.0. This list is updated when there are changes to existing fields or new fields are added. Currently, the list is in English only. Note that it may be necessary to scroll through the sheets on the Excel spreadsheet in order to access the first sheet.
To access Reporting 2.0, go to
For more information about Reporting 2.0 permissions, see the following:
- Permissions in Reporting 2.0 - This provides detailed information about Reporting 2.0 permissions.
- Permissions List - This provides the list of permissions and their relationships so that you know which permissions users need to have to create and view reports.
Hide/Display Builder Tab Sections
You can hide or display any section in the Builder tab. To do this, click the Show/Hide Report Options icon ![]() in the upper-right corner of the Builder tab. Then, toggle on or off the Header, Filters, or Charts options in the Designer Options section.
in the upper-right corner of the Builder tab. Then, toggle on or off the Header, Filters, or Charts options in the Designer Options section.
Compensation Field Currency Conversion
The currency conversion option ![]() is available when using Compensation fields so that you can convert the currency. The option only displays when a Compensation field is added to the report. Fields from the following sections will enable the option to display:
is available when using Compensation fields so that you can convert the currency. The option only displays when a Compensation field is added to the report. Fields from the following sections will enable the option to display:
To convert the currency in the report:
- Click the currency conversion icon
 in the top-right of the header. This opens the Currency panel. When available, the currency conversion icon is displayed in between Properties and the Share Report icons.
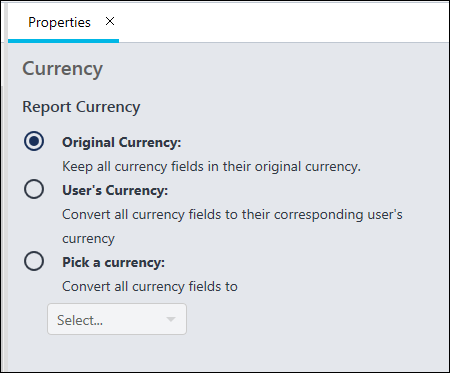
 - Select one of the following options:
- Original Currency - Select this option to keep the currency as is. The original currency in the report will not change.
- User's Currency - Select this option to change the currency to the currency of each user in the report. For example, you are reporting on salary data for users in the United States and France. Selecting the User's Currency option will display a France user's currency as EUR and a United States user's currency as USD. Note: An employee's currency is defined in Employee Salary Management. See Employee Compensation Administration.
- Pick a currency - Select this option to set the report to a specific currency from the drop-down. All currencies available in your portal appear in the drop-down.
Share Report
For information about the share report option, which is available by clicking the ![]() icon in the upper-right corner of the Builder tab, see the Share Report topic in Online Help.
icon in the upper-right corner of the Builder tab, see the Share Report topic in Online Help.
Report Delivery and Scheduling
For information about the report delivery and scheduling options, which are available by clicking the ![]() icon in the upper-right corner of the Builder tab, see the Report Delivery and Scheduling topic in Online Help.
icon in the upper-right corner of the Builder tab, see the Report Delivery and Scheduling topic in Online Help.
Data Panel
The Data panel lists the report fields that are available to you
You can search for fields in the search bar. Results will begin to show as you type, broken down by the field groups. If your search doesn’t apply to a specific Field Group, the group will be hidden.
Clicking the fields Properties button ![]() to the right of the search bar will give you field filter options if you know the exact field type(s) you want to search for. You can also filter by a specific field group, such as Learning, to only view fields related to Learning.
to the right of the search bar will give you field filter options if you know the exact field type(s) you want to search for. You can also filter by a specific field group, such as Learning, to only view fields related to Learning.
To add fields to a report, expand a report group and click the name of the field. This adds the field to the "Type or drag field here" area of the report builder. You can also drag and drop fields to the report builder, or you can type directly into the Type or drag field here area.
Note:
- If a feature/field has not been used and no data has ever been generated the field cannot be included in the report. Fields that have no data generated will not appear in the data panel.
- If a new custom field has been created and added to the report before the data warehouse has updated, report creators may see a message "Server Responded with failed to render report." In this situation, save the report and refresh and preview at a later time. The data warehouse normally refreshes every 15 minutes.
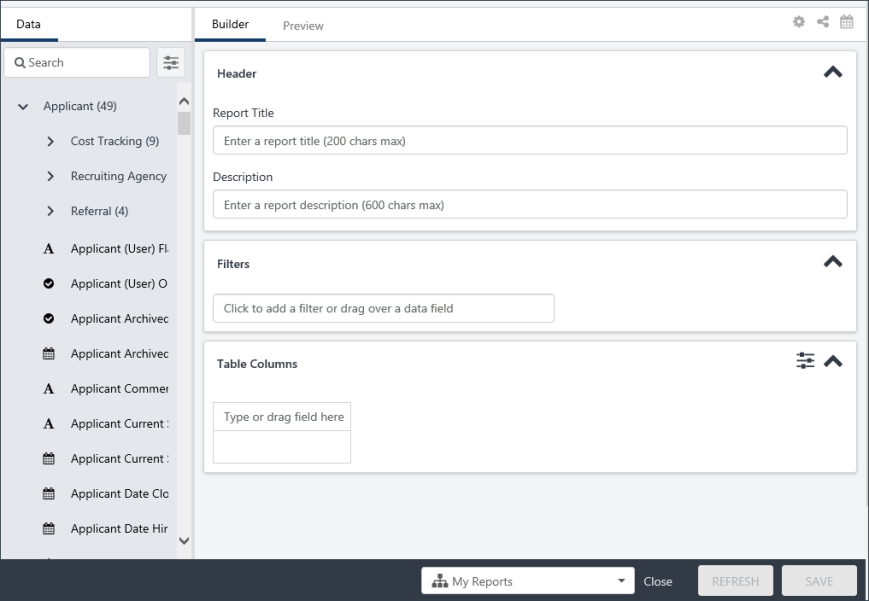
Builder Tab
The Builder tab is where the report is built. Fields are added to this section, as well as filters and the report name.
The following sections display:
In the Header section, enter the report title in the Report Title field. The field accepts up to 200 characters. You can also enter a description for the report in the Description field, which accepts up to 600 characters.
In the Filters section, you can add filters to the report fields. To add a filter:
- Type a field name into the text box and select a field from the list. Or, drag and drop a field from the Table Columns section or the Data panel. Once a field is added, an operator drop-down and value field automatically appear to the right of the field name.
- Select an operator, and then enter a value. The options for the operator and value differ, depending on the field.
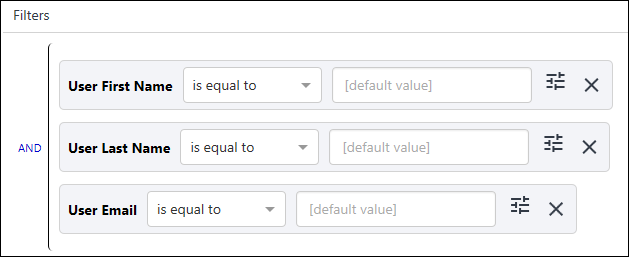
You can delete a filter by clicking the X to the right of the filter value.
Note: Filters allow a forward slash "/" to be used as a filter value and in a filter label. This lets you search for training that includes a forward slash in the title.
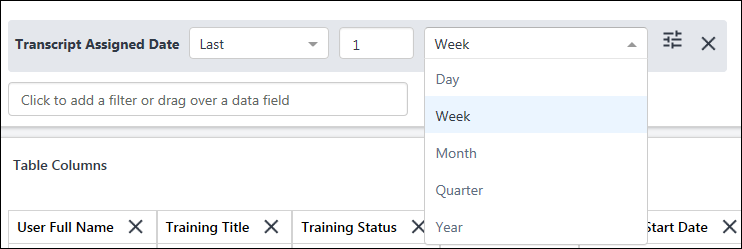
Dynamic date filters are available when creating reports that have date filters, such as the Transcript Assigned Date field. The following date filters are available:
- This - Note: In this case, "this" indicates "current."
- Week - Sunday 00:00:00 to Saturday 23:59:59 of this week
- Month - First to last date of this month
- Quarter - First to end of the following segments: Jan - Mar, Apr - Jun, Jul - Sep, Oct - Dec
- Year - First to last date of this year
- Last - Note: In this case, "last" indicates "previous."
- Day - 00:00:00 to 23:59:59 of yesterday
- Week - Sunday 00:00:00 to Saturday 23:59:59 of last week
“Last 1 week” = the previous week (If this week is Week 23 of the current year, the filter period is Week 22 between Sunday 00:00:00 to Saturday 23:59:59.)
- “Last 4 weeks” = the previous 4 weeks (If this week is Week 23 of the current year, the filter period is Week 19 at Sunday 00:00:00 to Week 22 at Saturday 23:59:59).
- Month - First to last date of last month
- Example: “Last 1 month” = the previous month (If today is in June, the filter period is May 1 to May 31)
- Example: “Last 2 months” = the 2 previous months (If today is in June, the filter period is April 1 to May 31)
- Quarter - First to end of the following segments: Jan - Mar, Apr - Jun, Jul - Sep, Oct - Dec
- Year - First to last date of the year
- Next - Note: In this case, "next" indicates "after" (i.e., the day after today, the week after this week, etc.).
- Day - 00:00:00 to 23:59:59 of the next day
- Week - Sunday 00:00:00 to Saturday 23:59:59 of next week
- Month - First to last date of next month
- Quarter - First to end of the following segments: Jan - Mar, Apr - Jun, Jul - Sep, Oct - Dec
- Year - First to last date of the year
- Yesterday
- Today
- Tomorrow
Note: When a report with relative date filter using Yesterday, Today, or Tomorrow is shared with another user, the filter is applied with respect to time zone of the shared user (e.g., the owner’s report will apply ‘Yesterday’ relative to the owner's time zone, and the shared user's report will apply ‘Yesterday’ relative to the shared user's time zone.).
For the Last filter option, you can configure the number of days, weeks, months, quarters, or years to which you would like the data to go back.
For the Next filter option, you can configure the number of days, weeks, months, quarters, or years to which you would like the data to go forward.
When filtering date/time fields, a clock icon is available so that you can filter by a specific time. For example, when filtering by the date a training is due, you can select a specific time on the due date so that you can further narrow the report results.
Note: Please be aware that if the report creator switches timezones, the date filters will continue to work with the prior timezone values until the report is saved again. Upon re-saving the report, the new timezone changes are reflected.
When at least two fields are added, you can use AND/OR logic. By default, it will be an AND statement, but you can change it to an OR by simply clicking the word AND.
Once you have at least two filters, you can create filter sub groups. Filter groups are not required for reports but let you create advanced logic.
To create a filter group:
- Drag a field over a filter. The filter appears in the corp color with no letters, giving you a preview of where your new filter will go.
- Drop the new filter on top of the existing filter. This creates a sub filter below the existing filter. This allows you to refine the report so that when you want to report on a limited amount of data, you can do so using filter groups.
You might want to create a sub group to combine AND/OR statements. For example, you might want to report on a specific Training Type, but add a sub filter group that includes training that has a Due Date during a specific period, or was Assigned during a specific period. You would add the Training Type filter, then add the Transcript Due Date and Training Assigned Date filters as a filter group, then change the sub filter Group logic to OR. Thus, the results would only include the specific Training Type selected AND training that was assigned during a specific date OR due on a specific date.
Reporting 2.0 has the following filter operators that account for blank fields:
- Empty - This indicates the data exists but does not contain a value. For example, an empty string value (i.e., text value) is represented as "".
- Null - This indicates the data does not exist.
Depending on the module on which you are reporting, empty and null values can represent something different in the data.
In Reporting 2.0, empty and null are available as the following filter operators:
- Is empty - This filter operator only includes empty string values in your report.
- Is null - This filter operator only includes null records in your report.
- Is empty or null - This filter operator includes any blank values in your report, combining both empty and null records.
- Is not empty - This filter operator excludes any blank values from your report, excluding both empty and null records.
- Is not null - This filter operator excludes any null values from your report.
Note for Custom Reports (Legacy) Users - The filter operators "is empty” or “is not empty" in Custom Reports would always include both empty and null records. To achieve the same result in Reporting 2.0, customers using these filters should use the “is empty or null” or “is not empty” filters. This is because Reporting 2.0 facilitates inclusion of both empty and null values to provide more control and granularity for segmenting report data.
The Past Due Aging field can be added as a filter. This filter lets you report on users who are X number of days past due on training, which is important data for compliance purposes.
This filter is available for Learning reports.
If ILT Preferences are configured to allow the vendor to be changed on events, then when one or more sessions for an event are tied to one provider, and one or more sessions of the event are tied to another provider, some sessions will not appear in reporting if the report is filtered by Training Provider and does not include all providers in the filter.
To ensure all providers are included in a report when filtering by Training Provider, be sure to add all providers to the filter.
Or you can choose not to filter by Training Provider to ensure data for all providers of an event or session is included in the report. This would include data for all providers available within your constraints.
When a Training Title is added to the Filter section, and the Training Title filter is set to is one of or is not one of, click to open the Select Training flyout. In the flyout, you can search for and select the relevant training titles on the SEARCH tab. Once you have selected one or more trainings, click the SELECTED tab to view all the selected training titles. The training titles have a Show all versions checkbox. When this option is checked, the report includes all versions of the training. If you clear the checkbox, the report will include only the latest version of the training.
When you select an Event in the Select Training flyout, Sessions will not display in the report output.
Enhanced Search is used to deliver results based on relevance. For more information on Enhanced Search, see See Enhanced Search.
When a User or Organizational Unit (OU) field is added to the Filter section, you are able to use the and buttons to open up a flyout. The flyout lets you easily select the user or OU by which you would like to filter. Once a user or OU is selected, you can include or exclude subordinates and review and remove selections from the Selected tab.
With these flyouts, the following operators are available:
- Is one of - This restricts the data to the selected users or OUs.
- Is not one of - This restricts the data to users or OUs that are not one of the selected users or OUs.
- Starts with - This restricts the data to users or OUs that start with the search criteria. At least three characters must be entered.
- Is not empty - This will show all users and OUs that have a user or OU value.
- Is empty - This will show all users without a value for that OU.
- Is empty or null - This will filter out all empty and null values.
Note: Calculated fields that include aggregate functions in the formula cannot be used as a filter.
Filter properties are optional and let you control the shared user’s experience of the filter. For example, you can determine in the filter properties if shared users should be able to remove or adjust the filters you have added when they use the report as their own. For example, if you set the Transcript Due Date field as hidden after you share the report with other users, they will not be able to see or interact with the filter because it is hidden. If you did not mark the other filters as hidden, then users with the ability to view those fields would be able to interact with those filters before previewing data or downloading results.
The changes made in filter properties can be viewed in both the Preview and Viewer.
Click the filter properties icon ![]() to open the filter property panel for the field. At the top of the panel, the name of the field displays. Also, the field is highlighted in the Filters section. This lets you easily see what filter you are adjusting.
to open the filter property panel for the field. At the top of the panel, the name of the field displays. Also, the field is highlighted in the Filters section. This lets you easily see what filter you are adjusting.
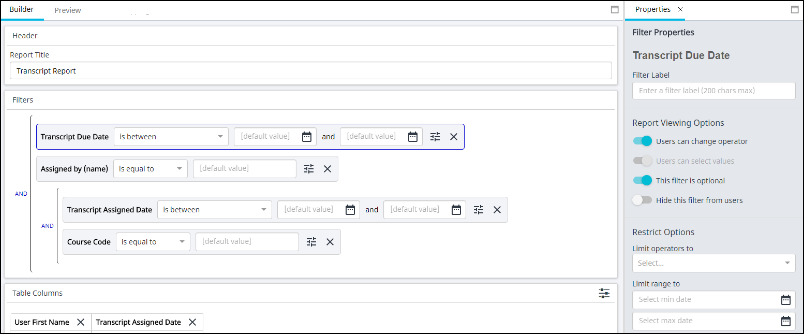
The Filter Label text box lets you rename the filter within this report. Changes made here will appear in both Preview and Viewer mode of this report. Changes will not apply to the Table Column if the field has been brought into the report. By default, the Users can change operator and This filter is optional are toggled ON.
The available Reporting View options include:
- Users can change operator - This option determines whether users can change the operator of the filter. When ON, users can change operators. When OFF, users cannot change operators. For example, if the option is OFF, users must use the operator chosen by the report builder.
- Users can select values - This option determines whether users can change the value of the filter. When ON, users can change the value. When OFF, users cannot change the value. For example, if the option is OFF, users must use the operator chosen by the report builder.
- This filter is optional - This option determines whether users are required to fill out the filter. When ON, users are not required to fill out the filter. When OFF, users are required to fill out the filter. For example, if the option is OFF, users would be required to use the selected filter.
- Hide this filter from users - This option determines whether users can see the filter in Viewer. When ON, users cannot see the filter. When OFF, users can see the filter. For example, if the option is ON, users cannot see the filter because the filter criteria they need is already set.
The available Restrict Options include:
- Limit Operators To - These let report builders control which operators that shared users can select.
- The Users can change operator field must be ON in order to limit operators.
- The available operators in the drop-down list will reflect the field type selected.
- Multiple operators can be selected.
- Remove an operator by clicking the X icon.
- Limit Date Select To - These let report builders limit the date filter values. The available options are Yesterday, Today, Tomorrow, and Select Date.
- Limit Values To - These let report builders control which values that shared users can select. You can type in values here by which a user would be able to filter.
- Limit Range To - These let report builders limit the date criteria that shared users can select between.
Note: The operators, values, and date fields will differ based on the field by which you are filtering. For example, if you filter by a Date field, you will see the Limit range to option. If you filter by a Title field, you will not see the Limit range to, but instead will see the Limit values to.
Note: If you limit the values available in a filter, shared users can still remove these values entirely. This means they could view the entire, unfiltered report. The output of the report will always be based on the applicable constraints.
The fields you add to the report display in this section. Each field will display as a column in the report. You can add fields to this section by left-clicking on the field or dragging and dropping them from the Data panel.
Or, if you know what you want your column header to be, you can quickly add column headers directly from the Table Columns section. To do this, start typing the name of the field you want in the column. You’ll see suggested values appear based on the text you have entered. To make it easier to find the right column, fields are prefixed with the field group (e.g., Applicant or Assignment).
You can delete a field by clicking the X to the right of the field name.
You can re-order fields by clicking and dragging to a different column position.
Reporting 2.0 lets you change the name of your column headers to make it easier to identify the data you are running in a report. This is also helpful when sharing a report so that users are able to understand more easily the data you are providing in each report column.
To change the name of a column header:
- Click the icon
 to the right of the field name in the Table Columns section. This opens the Column Header Properties icon.
 - Enter a new column name in the Column Header label field.
- Click at the bottom of the page. This saves the setting to the report. Note: If you only click Refresh after changing the column header name, the Preview tab will show the change, but the setting is not saved to the report.
The new column name is not visible on the Builder tab but is visible on the Preview tab.
The name change applies to charts and filters, as well as to the exported report and exception reports. However, you can opt to change the name of a filter and/or chart axis if you do not want to use the updated column header name.
Shared users will also see the name change.
Report Properties
To enable or disable Show/count unique rows only feature, click the Show/Hide Report Options icon ![]() in the upper-right corner of the Builder tab, which opens the Report Properties panel.
in the upper-right corner of the Builder tab, which opens the Report Properties panel.
Toggle the Show/count unique rows only option On to filter the summarized report results so that rows are not repeated when they display identical summarized information. For example, if a Transcript report only contains the field User Full Name, and the report results include 50 different users with the name "Sample User," then checking Show/count unique rows only will only display one row of name "Sample User" in the report. Note: This is an advanced feature and should be left on in most portals, which is the default value.
This option lets you show or hide the name of the section for each field in the report. This helps to avoid confusion when fields in different sections have the same or similar names. For example, the User Full Name field exists for User, Successor, and Incumbent sections. When the Show Field Prefixes option is toggled off, the field displays as “User Full Name,” regardless of the section in which it appears. However, when the option is on, the field displays as "User - User Full Name,” which provides the name of the section before the field name.
You can enable or disable this feature by toggling it on or off in the Properties panel. If there are multiple fields with the exact same name in your report (e.g., User Full Name from the User section and User Full Name from the Manager section), this feature is on by default and cannot be turned off.
Charts that are created for a report in Reporting 2.0 can be published as dashboards. See Reporting 2.0 - Publish to Dashboards.
When you use the Apply Owner Constraints option, you can enable other users to view the report with the same constraints that you have. This lets report viewers see any data in the report, chart, and dashboard to which your constraints give you access. This also applies to shared reports and reports that are scheduled for delivery.
You can still limit what users see by using the Filters section on the Builder tab. This lets you add filters that restrict the data that appears in the report. Note: Shared users can remove the filter values defined in limit values, which provides them the full output following the report owners constraints.
Users must have the permission in order to have access to use this option.
To apply owner constraints:
- Click the Show/Hide Report Options icon
 on the Builder tab of the report. This opens the Properties tab.
 - Toggle the Apply Owner Constraints option to on. This opens a confirmation pop-up.
- Click in the confirmation pop-up. This confirms that you are running the report with your constraints, meaning that users who view the report will see the same data that you see.
An executive is viewing a report you created. She can only see data that is within her constraints. However, she needs to see data for all users in her Division Organizational Unit (OU).
You toggle the Apply Owner Constraints option to On and confirm the change. You open the report in View mode to make sure the report only contains data that she should be able to see.
By applying owner constraints, you do not need to manage other permissions and constraints to allow her access to the report data she needs. You also do not need to bother changing the user's permissions and constraints back to their previous state once she is done with the report. Further, because you have not removed constraints completely, the user is not able to see all data; they only see what you as the report owner can see.
To make sure users don't see more data than intended, it is advised to:
- Set report filters in the Filters section on the Builder tab
- Control what users can see when they run the report by setting the Report Viewing Options in the Filter Properties panel; make sure users are not able to remove/change filters in the Report Viewer that would allow them to see more data than intended
- Limit filter criteria
- Open the report in View mode and test the filter settings before sharing the report
The users with whom you share the report will see what is visible within your owner constraints. They can copy the report but will not have the ability to waive your constraints.
- If the Hide Report Header option is toggled on, the header rows that usually appear at the top of a report are not included when the report is exported.
- If the Hide Report Header toggle is set to "Off" for a report, users can view the following details from the downloaded report:
- Report Title
- Report Generated by
- Report Generated Date/Time
- Report Count
- Report Count Limit
- Report Source - Portal address is displayed as a URL
The Display Filter Criteria option lets you include the filter criteria used in the report. To enable the filter criteria to display, toggle on the option.
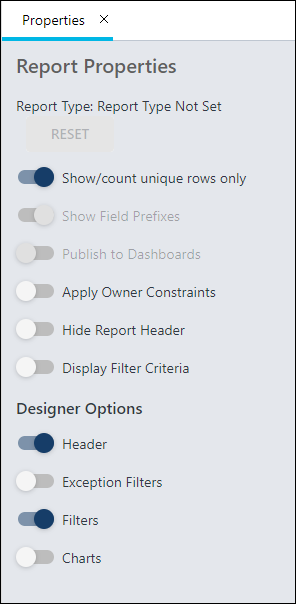
Table Properties
The following options may be available in the Table Properties:
- Only Show Summary Rows
- Merge Summary Rows - When the toggle is enabled, the output file will merge the matching rows in summarized columns. This is the default setting. When the toggle is disabled, summarized columns are populated in each row separately. The toggle is only be accessible if at least one column summary has been added.
- Show Grand Summary
- Show Summarized Hierarchy Output - When this toggle is enabled, hierarchy summary shows all the levels of hierarchy in one column. This is the default setting. When this toggle is disabled, hierarchy summary shows the levels of hierarchy in individual columns. Note: The toggle impacts only the Microsoft Excel output format.
Reports can be sorted and summarized using the options in the Column sorting and Column summary sections. See the following for information on how to sort and summarize:
- Column Sorting - The sort feature lets you define the sort order of the fields you selected for the report. By sorting the report fields, you can define which column displays first, and so forth, in the report output. See Reporting 2.0 - Sort Report.
- Column Summary - The summarize feature lets you summarize the data in the report based on certain fields. See Reporting 2.0 - Summarize Report.
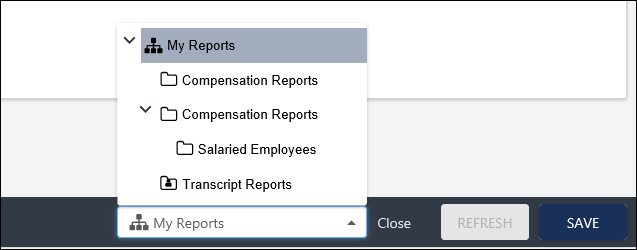
My Reports Folder Option
Pre-Step Note: You must have at least one folder created on the homepage in order to add the report to a specific folder other than adding it to the My Reports area. Folders cannot be created from within the Report Builder.
The My Reports option at the bottom of the Report Builder lets you determine the folder you want the report to be stored in when creating or editing a report. Folders let you organize and manage the distribution of your reports, and you can share the folders with others. Also, you can group reports together based on your own criteria or themes, enabling you to easily find the reports you need.
To add the report to a folder, click the My Reports drop-down. Select the desired folder from the drop-down, then click when you are ready to save the report.
After the report has been saved, it will save to the selected folder and remain in the folder for as long as you own the folder. If the folder is one that has been shared with you, the system will save the report to My Reports by default.
Preview Tab
Clicking the Preview tab for the first time will refresh your report and provide you with a preview of the report you have built. If you make additional changes after previewing, you will need to click the button.
Preview data shows 1,000 rows of data, which will be randomly selected. Any filters you have hidden in Properties will remain hidden in the preview, as well as any restrictions made.
You can sort the report directly from the Preview tab, in addition to being able to sort from the Report Properties panel. However, changes you make to the columns will overwrite the sort order you created in the Sort panel. For this reason, it is a best practice to use the Sort panel to sort the report.
To sort from the Preview tab:
- Click the name of a column (the field name) to sort the report by that field.
- The sort order automatically changes to sort by the column you selected. Notice that the column sorting information in the Sort panel changes to show the column name you selected. If you had a sort order already configured in the Sort panel, those settings are overwritten by manually changing the sort order on the Preview tab.
- The sort order is Ascending by default. Click the column name or click the arrow to the right of the column name to change the sort order to Descending.
Note: A different number of records may be seen when viewing the report data in Edit - Preview, View, and Excel and Download modes. This occurs because the different ways of viewing the data use a different top number of records.
- Preview uses the top 1000 records
- View uses the top 2000 records
- Download (view cloud icon, schedule for now) uses the top 200,000 records
Reference article: https://cornerstoneondemand.my.site.com/s/articles/Report-Values-Discrepancy-in-Excel-vs-View-or-Edit-mode-Reporting-2-0
Save and Close Report
At the bottom of the page is the Save and Close bar. The bar is responsive, meaning that as you adjust the size of your browser window or scroll up and down the page, the and buttons are always visible. Click or to save your report. When Close is selected, you are brought back to the report landing page.