The summarize feature lets you summarize the data in the report based on certain fields. For example, you may want to summarize a report to make the data easier to read, or you may prefer to have information summarized so that it appears in groups of data rather than as a list of data.
This feature is similar to the summarizing feature that is available from the Summary tab when configuring Custom Reports.
To access Reporting 2.0, go to
For more information about Reporting 2.0 permissions, see the following:
- Permissions in Reporting 2.0 - This provides detailed information about Reporting 2.0 permissions.
- Permissions List - This provides the list of permissions and their relationships so that you know which permissions users need to have to create and view reports.
A report administrator wants to present their data in an easily digestible and understandable way. She wants to be able to summarize the information by specific fields to compare specific values against a particular field. For example, she wants to build a report to show the training record status for a specific organizational unit (OU) or department to cross-reference which users have the risk of being out of compliance. The summary feature lets administrators, key stakeholders, and users more easily view their data and take actions on the information straight from Reporting 2.0, without the need to export the data or view it in a different program.
A user (Director) wants to understand which locations are completing the specific training module on time. For example, he views a report to summarize by user location to better understand which regional sales representatives are staying up to date with new product offerings. He can summarize by percentages to understand the relative amount of completions per division. Since the training is for new products, he can understand which sales representatives are keeping up to date on their assigned curriculum. This will give him better information to use in one-on-ones with his direct reports about their team's targets and metrics.
An administrator wants to sort her report by specific date ranges, because she needs to be able to find specific data during specific time periods. She uses the drop-down in the Column Summary section to select a data range. This option is available for the field because it is a Date type field.
- As a report administrator, I want to summarize my reports by various fields, such as different divisions, departments, or OUs to understand the complexities of the data and create meaning within the reports.
- As Senior Vice President, I want to have a chart summarized by Division OU so that I can view average performance ratings by division.
- As a manager, I want to summarize a report by User so that I can see each member of my team and their performance ratings as visual groups that I can expand and collapse within the report.
- As a manager, I want to summarize a report by Location OU so that I can view the data in location groups.
- As a report viewer, I want to change the summary so that I can understand the data better as it relates to my job function, team, or responsibilities. For example, I want to summarize the number of team members who have not completed a specific training or learning object (LO) type to show me who is out of compliance and needs to complete a specific training.
Add Fields to Summarize
You can summarize the report by up to five levels. To add fields to summarize the report:
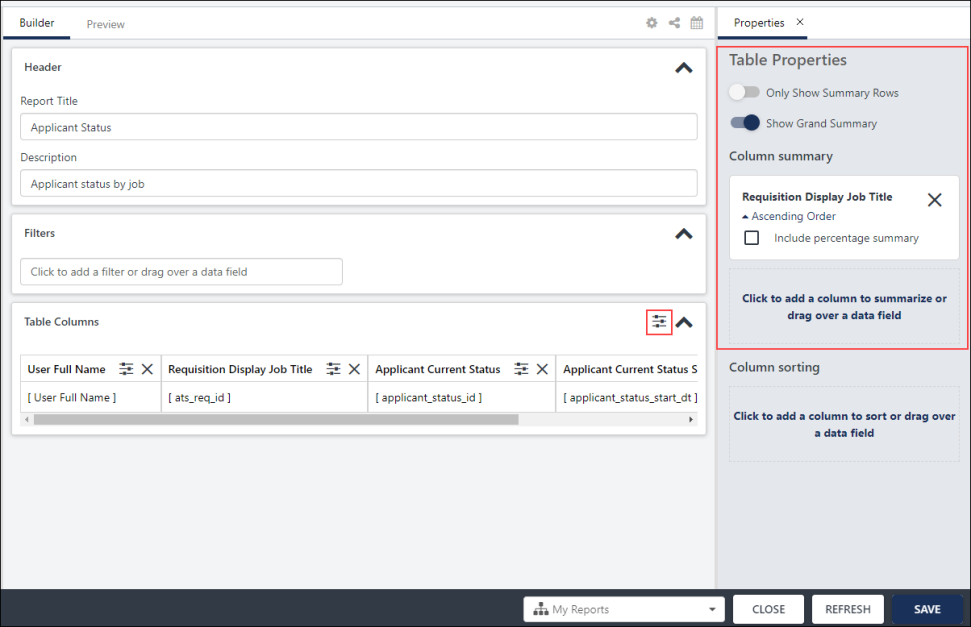
- Click the Show Table Properties icon
 in the upper-right corner of the Table Columns section. This opens the Table Properties panel.
 - Click and drag a field from the Table Columns section to the Column summary section on the Table Properties panel. Or, click Click to add a column to summarize to search for and select a field.
- You can summarize the report by fields that are not in the report by selecting a field from the Click to add a column to summarize option on the Table Properties panel, then delete the field from the Table Columns section on the Builder panel. Note: By default, summarizing by a field adds the field to the report twice: once as summarized column and once with the raw data. You can remove the raw data column from the report if you do not want the field included in the output twice.
- A field can only appear once in the summary.
- A field in the Column sorting section cannot be used to summarize the report.
- Keep the summarized data in ascending order, or click the arrow to the left of Ascending Order to switch to descending order.
- Date Field Types - When summarizing by date fields, a drop-down is available in the Column Summary section to let you pick the type of order, including Day, Week, Month, Calendar Quarter, and Calendar Year.
- Check or uncheck the option to View as hierarchy. This option lets you report on a user or OU hierarchy and will automatically display your report data in a hierarchical manner. Note: This option is only available when you summarize by an OU or OU ID field (includes standard and custom OUs).
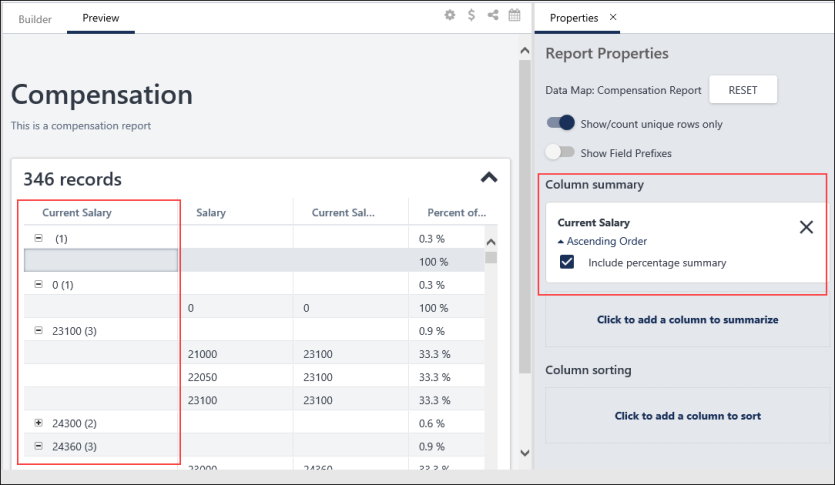
- Check or uncheck Include percentage summary to display percentages relative to the parent level in the hierarchy or summary. This option is unchecked by default.
-
Show Summarized Hierarchy Output - When this toggle is enabled, hierarchy summary shows all the levels of hierarchy in one column. This is the default setting. When this toggle is disabled, hierarchy summary shows the levels of hierarchy in individual columns. This toggle is only available when "View as Hierarchy" has been selected. The toggle impacts only the Microsoft Excel output format.
The percentages are flexible in that they are configurable at different levels of the report. For example, if Division A has a transcript status of Completed, then the percentages are calculated based on the total number at the Division level. If Division A has 500 people and 50 of them have a training item in a Completed status, then the hierarchical percentages are calculated out of 500 people (10%).
Only Show Summary Rows
When the Only Show Summary Rows option is toggled on, the report output will only show summarized and aggregated fields, and it will not include the rows for the underlying data in the report.
When using the Only Show Summary Rows option in combination with a chart, the aggregation is driven by the selection made on the field in Column Header Properties. With that the aggregation operation for the measure field on the Chart is also no longer shown. If you have defined a chart before, but the Chart Measure and Field Aggregation are not in sync, the Only Show Summary Rows will be disabled until the two are in sync. For example, if you chose Count in the Apply Aggregation field on the Column Header Properties panel, then Count would need to be selected in the Measure field on the chart to get the fields in sync and enable the Only Show Summary Rows option.
Note: If one of the fields included in a calculated fields is set to inactive, the calculated field will not be displayed.
Show Grand Summary
When the Show Grand Summary option is toggled on, the report displays the grand summary for a summarized report.
Remove Summary Fields
You can remove fields from the "Column summary" section by clicking the X to the right of the field name.
Preview Summarized Report
When viewing a summarized report, the summarized data groups display in the first column on the Preview tab. The data can be viewed by expanding each section in the summarized column.
If you selected to include the percentage summary, this information appears as the last column in the report.
Export Hierarchically Summarized Report to Excel
When you have summarized your report and selected the View as hierarchy option, your output in excel will look slightly different. The report data will show in a table format with row grouping on the left-hand side.
You can use the grouping to collapse and expand your data. The cells are merged to create an easier view. This allows the hierarchical summaries to be grouped with less text.
If you would like to use filters to see only the rows belonging to a specific criteria, then it is recommended that you filter by that specific value in the data column and use the grouping on the left-hand side to expand/collapse all rows belonging to that value.
Charts in Summarized Reports
When using charts in summarized reports, the fields used in the summary no longer link automatically to the chart. This provides more flexibility in how you create and organize your charts, while still having the ability to determine separately how you want your table data to be summarized.