Compliance Guide Dashboard
Compliance risk represents the risk associated with employees not finishing a learning object by the required deadline. Lack of employee compliance with deadlines can result in regulatory fines and/or may prevent employees from performing their assigned duties. The Compliance Guide dashboard is designed to provide a better understanding of the factors that contribute to achieving high compliance rates and help advise in long-term corrective policies designed to reduce risk.
From the dashboard, you can analyze the factors that are predictive to the organization's on time course completion, determine potential actions to increase compliance rates, and help identify meaningful policy changes that can direct the organization to achieving higher long-term compliance rates.
The data in the Compliance Guide dashboard is calculated by looking at historic compliance levels and the factors that drive compliance. The data also looks at how the factors differ across the organization and what steps can be taken to increase compliance.
Analyze by Organizational Unit
The options in the upper-right corner of the dashboard allow you to select a specific organizational unit (OU) type by which to analyze. The OU types that are available in the drop-down are the OU types that are created for the portal. To select an OU, click the drop-down and select the OU type.
Compliance Rate
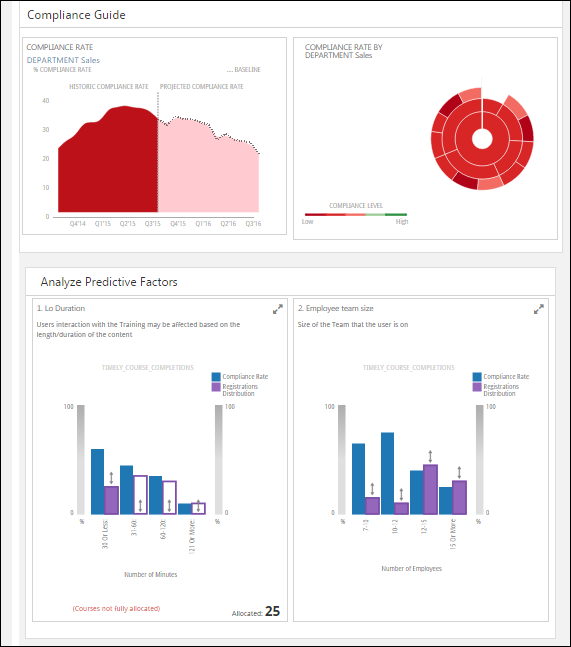
The Compliance Rate card shows a graphical representation of the historic compliance rate over a 1-year period, which is divided quarterly, and has a calculated forecasted rate of compliance looking ahead and divided quarterly. The future compliance rates are reflective of the current course registrations that are due in the future.
Compliance Rate by [Organizational Unit]
The Compliance Rate by [Organizational Unit] card shows a chart with the selected OUs and their compliance rating identified by a low to high color, where green represents a high level of compliance and red represents a low level of compliance. The color for a given OU is determined by the historic compliance rate in the Compliance Rate card. The colors are not customizable.
The compliance level is plotted from low to high (red to green) where the compliance level looks back over the course of the past data in the trend chart. For example, if the trend chart looks at the past four quarters in the historic section, this means that the historic information is comprised of those four quarters in the sunburst.
Each color box in the chart represents an individual OU. Hovering over a color box opens a tooltip that displays the department name, compliance rate percentage, and number of courses that are overdue for completion. Clicking on the color box drills into the OU and updates the Compliance Rate card and the predictive factors based on the data analysis for the selected OU type.
Analyze Predictive Factors
The Analyze Predictive Factors section displays a widget for each factor that contributes to predicting what makes users complete or not complete their training on time, based on the data in the Compliance Rate cards.
The following information displays in each widget to help understand the course completion rates for each group represented in the X axis:
- Name of the predictive factor
- Chart illustrating how the KPI's compliance rates change for various values of the predictive factor
- KPI and factor appropriate labels on the chart
- Ability to select the factor cards individually
- Verbal description of the data in the chart
Show More
Click the Show More link at the bottom of the first row of cards to display additional predictive factors.
Select Individual Cards
You can select one or more individual cards to analyze. To select a card, click anywhere in the card. When a card is checked, a checkbox appears in the card to indicate that the card has been selected.
Clear Selection
Click the Clear Selection link to clear the cards you have selected.
View Selection
Click the View Selection link to see a pop-up of all the predictive factors that have been selected for analysis. This allows you to view the different factors selected prior to going to the analysis page.
Analyze All
Analyze Selected
This button displays if one or more individual cards have been selected for analysis. Click to analyze the selected predictive factors. This opens the Analyze Predictive Factors page, which summarizes the key insights and policy recommendations for the selected factors. This helps you understand the effects of changing some of the parameters surrounding the selected factors.