Training Progress Summary Pie Chart Report
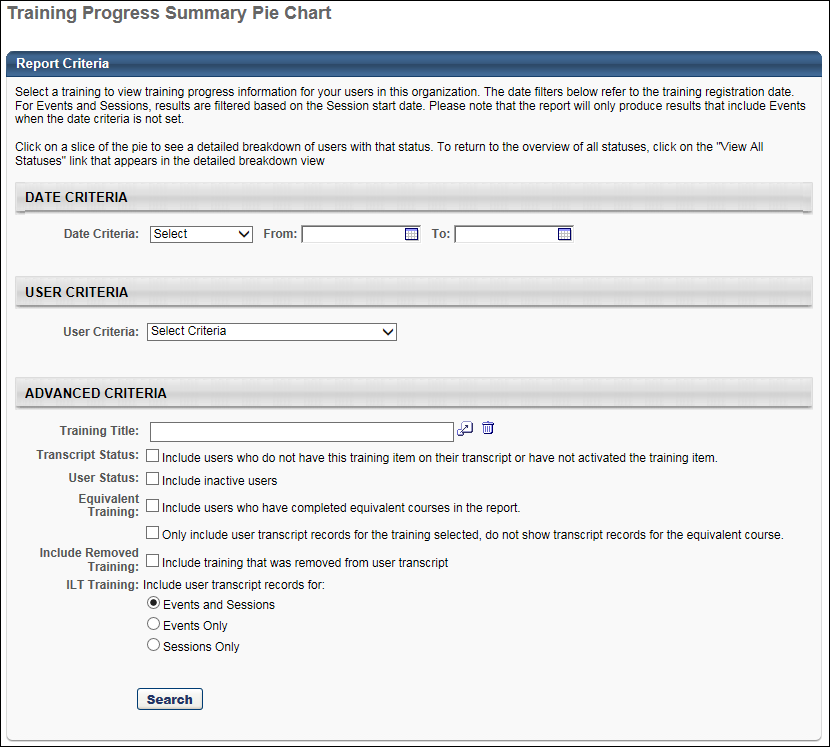
Display the percentage of users with certain statuses for a particular training item. The report output only includes records with latest registration number.
| PERMISSION NAME | PERMISSION DESCRIPTION | CATEGORY |
Criteria
Search
Click to run the report. This refreshes the page and displays the results below the criteria.
Output
- The report will generate on the page as an inline report. To see additional details by user, click the Details icon.
- The report will include all versions. The report output only includes records with latest registration number.
-
 Printable Version link to view the results in a web page, or
  Export to Excel link to save/open as an Excel file
 - Clicking on a section of the pie chart will refresh the page showing a new pie chart with the breakdown of user's training statuses. The Search Results table will be refreshed to show only the users with the statuses that fall under that status category.
- In the detailed view, a View All Statuses link appears next to the pie chart. Clicking on this link refreshes the page to show the summary of all status categories, which is the default view.
Note: Users who are in a Not Available status, as a result of being proxy enrolled into an LO that is configured to have an available date, are included in the Registered/Not Started segment of the pie chart.
*Equivalent Training Use Cases
Use Case 1: Both Equivalent Training Options Selected
- Training A and Training B are set as equivalents.
- 10 users have Training A on their transcript in a Completed status.
- Training B is assigned to 15 users:
- 10 of these users have Training A on their transcript; therefore, 10 of the 15 users get a Completed (Equivalent) status for Training B.
- The other 5 users complete the training and get a Completed status for Training B.
- Tom Jones is an Learning administrator and runs the Training Progress Summary Pie Chart report for Training B for all 15 users.
- He selects the existing option to: Include users who have completed equivalent courses in the report.
- He also selects the option to: Only include user transcript records for the training title selected, do not show transcript records for the equivalent course.
- The report output will show 15 transcript records, and will display the user transcript records for Training B for the 5 users who have completed the training (Status = Completed) and the 10 users who have completed the equivalent (Status = Completed Equivalent).
Use Case 2: Only the 'Include users who have completed equivalent courses' Option Is Selected
- Training A and Training B are set as equivalents.
- 10 users have Training A on their transcript in a Completed status.
- Training B is assigned to 15 users:
- 10 of these users have Training A on their transcript; therefore, 10 of the 15 users get a Completed (Equivalent) status for Training B.
- The other 5 users complete the training and get a Completed status for Training B.
- Tom Jones is an Learning administrator and runs the Training Progress Summary Pie Chart report for Training B for all 15 users.
- He selects the existing option to: Include users who have completed equivalent courses in the report. He does not select the option to: Only include user transcript records for the training title selected, do not show transcript records for the equivalent course.
- The report output will show 25 transcript records:
- 5 records for the users who completed Training B.
- 10 records for Training B for the users who completed the equivalent course (Status = Completed Equivalent).
- 10 records for Training A for the users who completed the equivalent course (Status = Completed). Note: These are the same users as 5b.
Supported Statuses
The Training Progress Summary Pie Chart Report is currently designed to support the following values for the Status field (i.e., supported statutes):
- Pending Approval
- Denied
- Approved
- Registration Pending
- Registered
- In Progress
- Completed
- Exception Requested
- Cancelled
- Waitlisted
- Pending Approval / Waitlisted
- Exception Requested / Waitlisted
- Deselected from user criteria
- Skipped
- Initial processing
- Recently entered availability
- Withdrawn
- Incomplete
- Failed
- Past Due
- Pending Approval / Past Due
- Denied / Past Due
- Approved / Past Due
- Registration Pending / Past Due
- Registered / Past Due
- In Progress / Past Due
- Exception Requested / Past Due
- Expired / Past Due
- Cancelled / Past Due
- Waitlisted / Past Due
- Pending Approval / Waitlisted / Past Due
- Exception Requested / Waitlisted / Past Due
- Withdrawn / Past Due
- Discontinued / Past Due
- Incomplete / Past Due
- Pending Completion / Past Due
- Failed / Past Due
- Pending Evaluation
- Pending Evaluation / Past Due
- Pending Prerequisite
- Pending Prerequisite / Past Due
- Waitlist Expired
- Waitlist Expired / Past Due
- Not Started
- Not Started/ Past Due
- No Show
- No Show / Past Due
- Pending Acknowledgment
- Pending Acknowledgment / Past Due
- Pending Grade / Past Due
- Pending Post-Work/Past Due
- Pending Pre-Work/Past Due
- Completion Approval Denied / Past Due
- Equivalent
- Completed (Equivalent)
- Pending Payment / Past Due
- Payment Denied /Past Due
- Pending Completion Signature
- Pending Completion Signature /Past Due
- Payment Refunded /Past Due
- Exempt-Internal
- Exempt
- Pending SF-182 Form Approval / Past Due
- SF-182 Form Denied / Past Due
- Registered / Not Available
- Registered / Not Available / Past Due
- Subscription Expired / Past Due
- Pending Observer Completion / Past Due
- Pending Observer Completion / Not Available / Past Due