Training Demand Forecast Accuracy Report
The Training Demand Forecast Accuracy report compares a training plan forecast with transcript data.
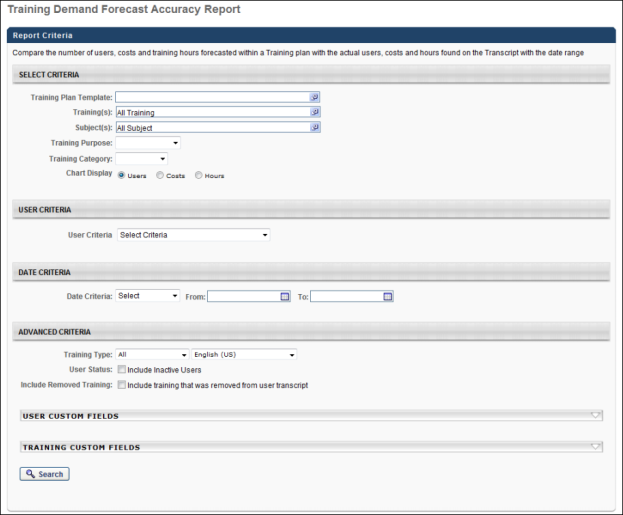
To access the Training Demand Forecast Accuracy report, go to Reports > Standard Reports. From the Training tab, click the Training Demand Forecast Accuracy Report link.
| PERMISSION NAME | PERMISSION DESCRIPTION | CATEGORY |
| Training Demand Forecast Accuracy Report | Grants access to the Training Demand Forecast Accuracy report, which compares a training plan forecast with transcript data. | Reports - Training |
Criteria
Output
The report output displays in a graphical view and as a table of results. Depending on the selection in the Chart Display field, the graph displays the User, Cost, or Hours chart.
For each category, Total, Planned, or Unplanned, the graph breaks the bar down into slices based on the transcript status. Each bar can be clicked to view the Training Progress Pie chart for that user population. Note: Selecting a slice changes the border color of the slice to light blue.
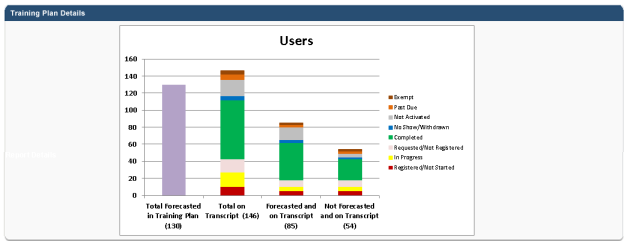
Users
The following displays on the axes of the Users chart:
- Y-Axis - The number of users.
- X-Axis - The number of transcript items that matched the criteria, as follows:
- Total Forecasted in Training Plan- Total number of users forecasted in the training plan that match the report criteria.
- Total on Transcript -The total number of items that were forecasted to be added to the transcript plus the total number of items that were added to the transcript but were not forecasted.
- Forecasted and on Transcript -The number of transcript items forecasted in the training plan.
- Not Forecasted and on Transcript -The number of transcript items that were not forecasted but are in the training plan.
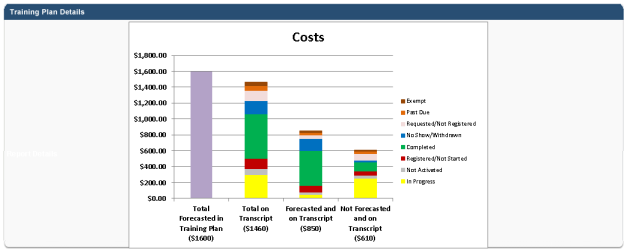
Costs
The following displays on the axes of the Costs chart:
- Y-Axis - The cost amount.
- X-Axis - The total cost of training items added to the transcript that matched the criteria, as follows:
- Total Forecasted in Training Plan - Total cost for all the trainings forecasted in the training plan that match the report criteria.
- Total on Transcript - The total number of items that were forecasted to be added to the transcript plus the total number of items that were added to the transcript but were not forecasted.
- Forecasted and on Transcript - The number of transcript items forecasted in the training plan.
- Not Forecasted and on Transcript - The number of transcript items that were not forecasted but are in the training plan.
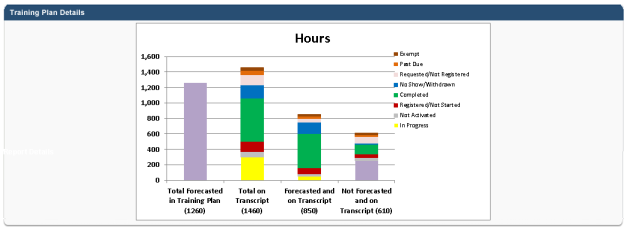
Hours
The following displays on the axes of the Hours chart:
- Y-Axis - The number of hours.
- X-Axis - The total number of hours of transcript items that match the criteria to determine whether they were planned or not planned:
- Total Forecasted in Training Plan - Total number of hours forecasted in the training plan that match the report criteria.
- Total on Transcript - The total number of items that were forecasted to be added to the transcript plus the total number of items that were added to the transcript but were not forecasted.
- Forecasted and on Transcript - The number of transcript items forecasted in the training plan.
- Not Forecasted and on Transcript - The number of transcript items that were not forecasted but are in the training plan.
Report Details
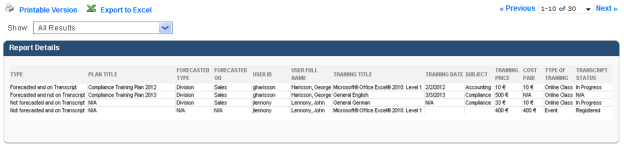
The Report Details table displays the search results selected in the Show Results drop-down. "All Results" is selected by default. The following additional filter options are available:
- Forecasted and not on Transcript - Displays items that were forecasted but not found on the transcript.
- Forecasted and on Transcript - Displays items that were forecasted and were on the transcript.
- Not forecasted and on Transcript - Displays items that were not forecasted but were on the transcript.
- All items on Transcripts - Displays all transcript items in the report.
By default, the results are sorted by Type, then Plan Title, and then Training Title. All columns in the table are sortable.