Compare the average pre and post training test scores for a group of training items.
| PERMISSION NAME | PERMISSION DESCRIPTION | CATEGORY |
| Learning Evaluation Comparison Report | Grants access to the Learning Evaluation Comparison report, which compares the average pre and post training test scores for a group of training items. | Reports - Training |
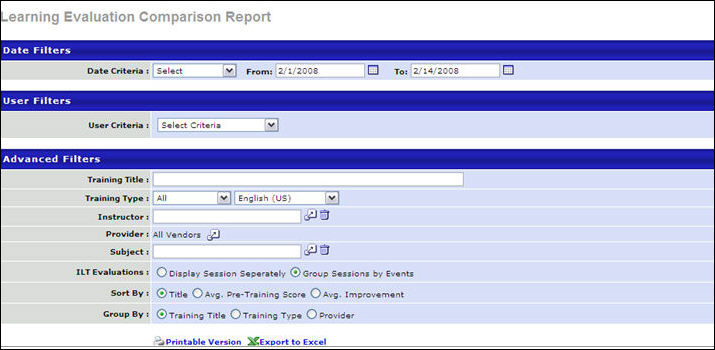
Filters
- Date Criteria - filter your results based on a specific time period. Note: Date Criteria is always implemented using UTC (Coordinated Universal Time).
- User Criteria - limit report output to the users matching the specified user criteria
- The report will only run within the defined constraints for the user running the report
- This is the standard OU availability selection criteria drop-down. Choose from available OU types
- Defaults: If no User Criteria are selected then the report will run for the entire available population
- Training Title - type word/s of title of event to search
- Training Type - filter the report on a certain training type or select All for all training types
- Instructor - filter by a specific instructor name
- Provider - filter the results for training from a specific training provider/vendor or select All for all training Providers/Vendors
- Subject - filter by specific subject
- ILT Evaluations - select to Display Session Separately or Groups Sessions by Events
- Sort By - select to sort by Title, Avg. Pre-Training Score or Avg. Improvement
- If the report is sorted by title, the bar graph will be alphabetically sorted by training title, type, or provider, depending on how it is grouped. The data columns will be sorted by the Training Title column.
- If the report is sorted by avg. pre-training score, the bar graph will sort increasingly to show the lowest pre-training score item first. The data columns will be sorted by the Avg. Pre-Training Score column.
- If the report is sorted by avg. improvement, the bar graph will sort increasingly to show the lowest improvement item first. The data columns will be sorted by the Avg. Improvement column.
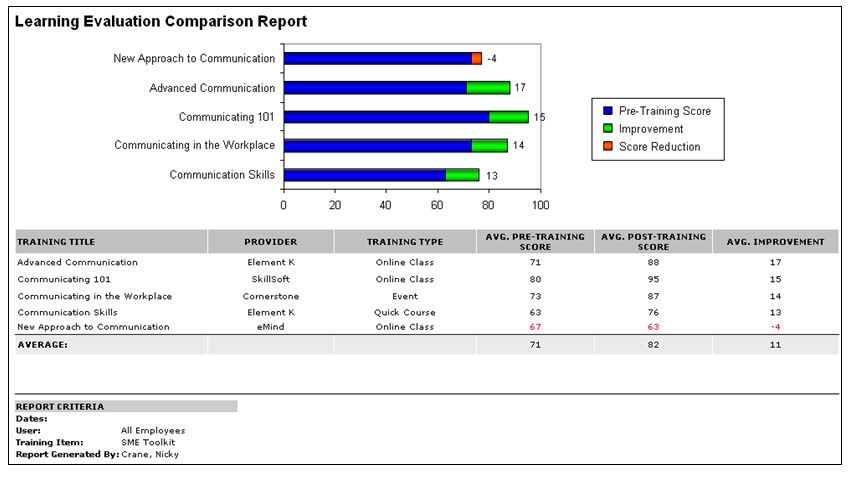
- The resulting report contains a stacked bar graph with the pre-training test scores in blue. The average improvement for each training item, type, or provider, is then stacked on top of the pre-training scores and appears in green. However, if the average improvement is negative, it appears in red.
- Group By - select to compare a group of Training Titles, Training Types or Providers. This option controls how the bar graph will appear in the report. It does not affect the columns that appear on the report; the report will always list the training titles of each training item that meets the filter criteria.
- If the report is grouped by training title, the bar graph will have a separate bar for each training item. The titles of the courses will be listed on the Y axis. See Example 1.
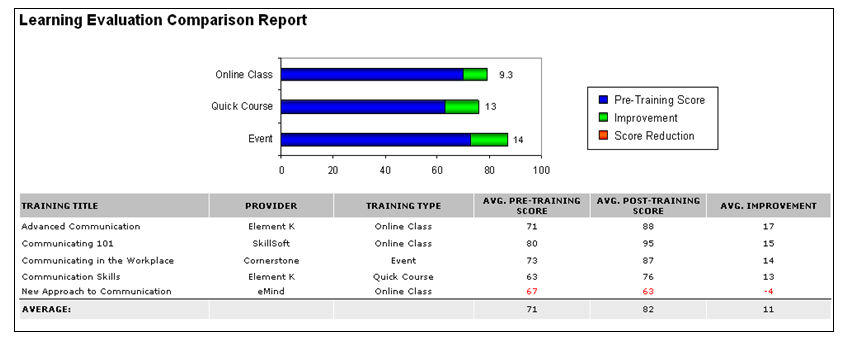
- If the report is grouped by training type, the bar graph will have a separate bar for each training type, which is listed on the Y-axis. See Example 2.
- If the report is grouped by provider, the bar graph will have a separate bar for each provider that meets the criteria. The provider names will be listed on the Y-axis.
Output
-
 Printable
Version link to view the results in a web page, or
Printable
Version link to view the results in a web page, or  Export to Excel
link to save/open as an Excel file
Export to Excel
link to save/open as an Excel file
Example 1: Group by Training Title
Example 2: Group by Training Type