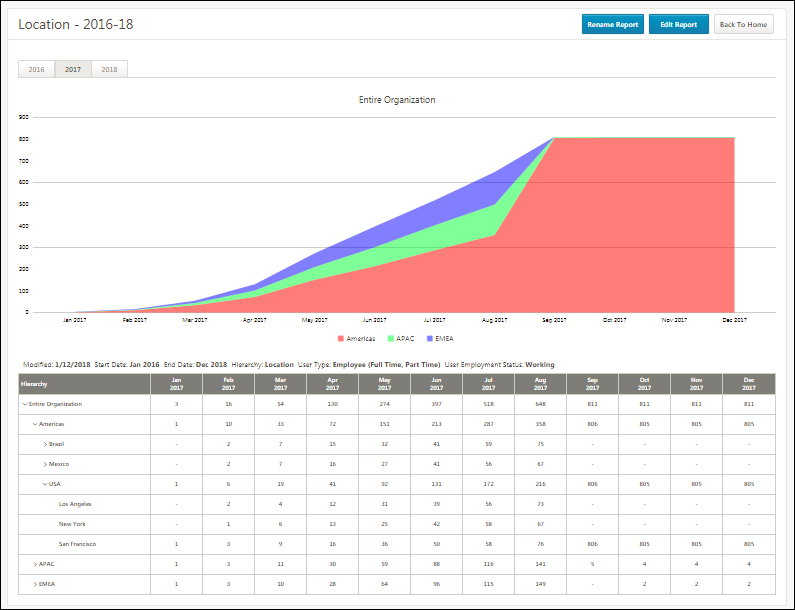
The output page of the Headcount Trend Report displays the number of hires across the organization and organizational units (OU). From here, you can view headcount data, rename the report, and edit the criteria.
Rename Report
Select o change the name of the report. The name can be changed at any time.
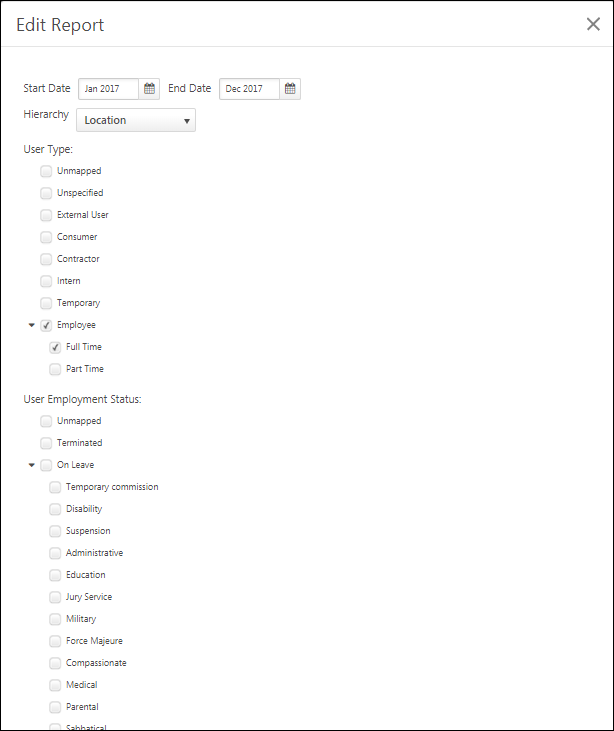
Edit Report
Click to change the criteria selected for the report. The report can be edited at any time.
Editing the report opens the Edit Report flyout. This shows your existing criteria and allows you to change your selections. From here, you can also change the report name and date range.
Report Years
The year tabs above the chart are the time dimensions. Click a year to view the headcount trends for that year.
Chart
A stacked area chart appears above the output table to show the results as a graphic. It is fixed on the top node of your hierarchy, or the highest parent OU in the table below, and it reflects the year displayed in the table. Each color in the chart represents the child OUs of the highest parent OU.
OU Hierarchy Drop-Down
The OU Hierarchy drop-down allows you to chart a specific OU. Click the drop-down and select an OU to view the chart data for that specific OU.
Filters
The list of filters, which were selected when creating the report, display below the chart.
Report Output Section
The report data displays in the columns below the filters.
- Hierarchy - This column displays the hierarchy values, as defined in the field when configuring the report. The values will vary based on your hierarchy selection. You can click within the hierarchy to view headcount at different levels. Note: If the OU selected does not have a valid parent OU, then the selected OU will appear under the "Unmapped" section in the table.
- Month/Year - These columns display the number of headcount per month within the time period defined when configuring the report.