The Recruiting Agency Statistics report is a new report that enables you to report on agency statistics and cost. This report enables you to track where agency costs are being spent and determine which agencies are the best performers. The information in this report can also help organizations understand and track the cost of recruiting new employees.
To access the Recruiting Agency Statistics report, go to Reports > Standard Reports > Recruitment.
| PERMISSION NAME | PERMISSION DESCRIPTION | CATEGORY |
| Recruiting Agency Statistics Report | Grants access to the Recruiting Agency Statistics report, which displays recruiting agency submission details. This permission cannot be constrained. | Reports - Recruiting |
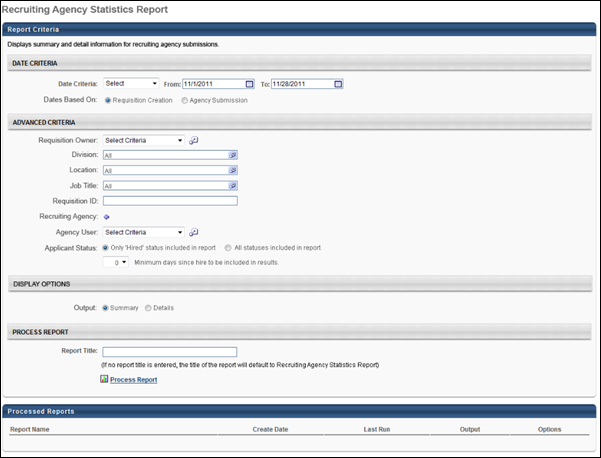
Criteria
When the Process Report link is clicked, the report is run based on the selected criteria. The report output is stored in the Processed Reports table.
The administrator can choose the following actions and options for each report in the Processed Report table:
- Click the Excel icon to generate an Excel output of the report.
- Click the Refresh icon to refresh the report results.
- Click the View Details to view the filter criteria for the report.
- Click the Delete icon to delete the report.
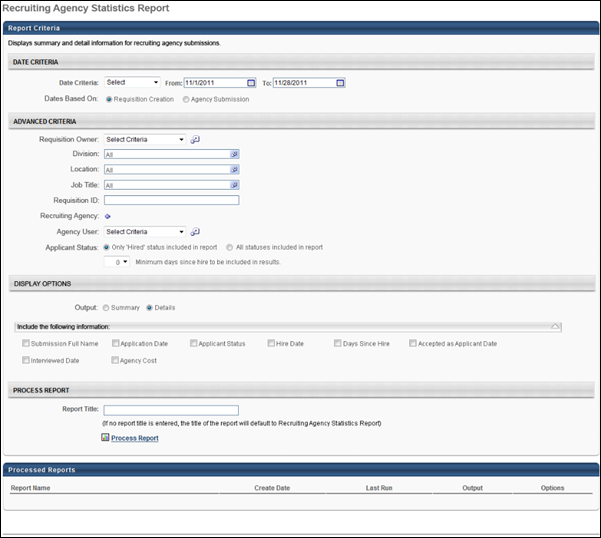
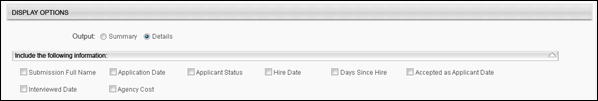
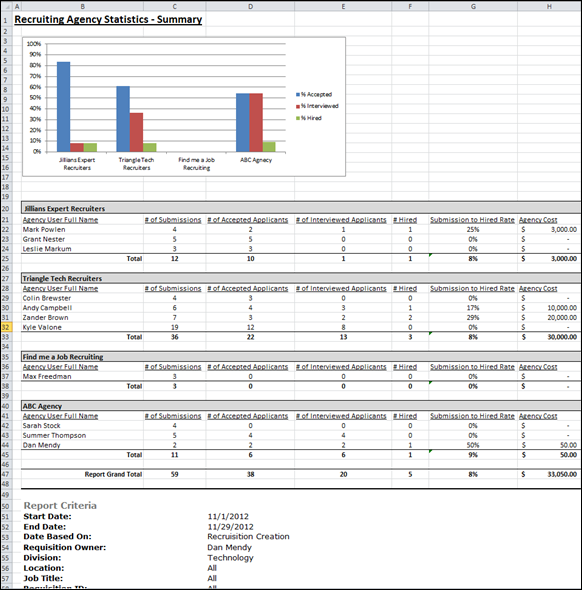
Output - Summary
The summary view of the report is an Excel table with a bar graph included.
Graph
- X Axis - This axis displays the name of the recruiting agency.
- Y Axis - This axis displays percentages, from 0 to 100 in 10 percent increments.
- Bar 1 - This bar displays the percent of accepted applicants. The percentage is calculated by dividing the total number of accepted applicants for the agency by the total number of submissions to the agency. Note: An "accepted" applicant is an applicant that has a candidate date.
- Bar 2 - This bar displays the percent of applicants interviewed. The percentage is calculated by dividing the total number of applicants interviewed for the agency by the total number of submissions to the agency. The value for total number of applicants interviewed is dependent upon completion of the Interview status. Applicants achieve completion the first time that the applicant is moved into the Scheduled Interview applicant status that is defined as the status type Interview.
- Bar 3 - This bar displays the percent of applicants hired. The percentage is calculated by dividing the total number of applicants hired for the agency by the total number of submissions to the agency.
Table
Each recruiting agency displays in a separate table. Agencies appear in the report in alphabetical order. All submissions within an agency are grouped by agency user. The following columns display:
- Agency User Full Name - This column displays the name of the agency user.
- # of Submissions - This column displays the total number of submissions per agency user.
- # of Accepted Applicants - This column displays the total number of accepted applicants per agency user.
- # of Interviewed Applicants - This column displays the total number of applicants interviewed per agency user. The value for total number of applicants interviewed is dependent upon completion of the Interview status. Applicants achieve completion the first time that the applicant is moved into the Scheduled Interview applicant status that is defined as the status type Interview.
- # Hired - This column displays the total number of applicants hired per agency user.
- Submission to Hired Rate - This column displays the hired ratio. The ratio is calculated per agency user by dividing the total number of applicants hired by the total number of applicants submitted.
- Agency Cost - This column displays the total agency cost per agency user.
- Total - This row displays the totals for each column.
- Grand Total - This row displays the totals for all of the agencies included in the report.
Note: The information that displays in the report is the information that meets the report criteria.
Report Criteria
The Report Criteria section displays the criteria values configured for the report.
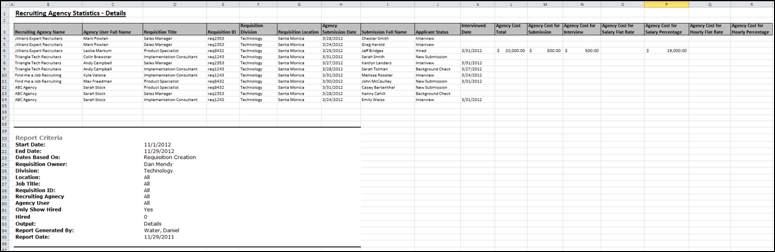
Output - Details
The details view of the report is an Excel table that displays the columns selected in the Display Options section when configuring the report. If Agency Cost is selected in the Display Options section, then the following associated columns appear:
- Agency Cost Total - This column displays the total agency cost for the submission.
- Agency Cost for Submission - This column displays the agency cost of each submission.
- Agency Cost for Interview - This column displays the agency cost per interview.
- Agency Cost for Salary Flat Rate - This column displays the agency cost per salary hire flat rate.
- Agency Cost for Salary Percentage - This column displays the agency cost per salary percentage.
- Agency Cost for Hourly Flat Rate - This column displays the agency cost per hourly flat rate.
- Agency Cost for Hourly Percentage - This column displays the agency cost per hourly percentage.