Driver Details
The Driver Details page provides additional insight into specific driver questions and allows you to view a breakdown of responses and a world cloud which visually represents common response topics.
To access the Driver Details page, go to and scroll to the bottom of the Engage Dashboard page. Then, click a specific driver question.
| PERMISSION NAME | PERMISSION DESCRIPTION | CATEGORY |
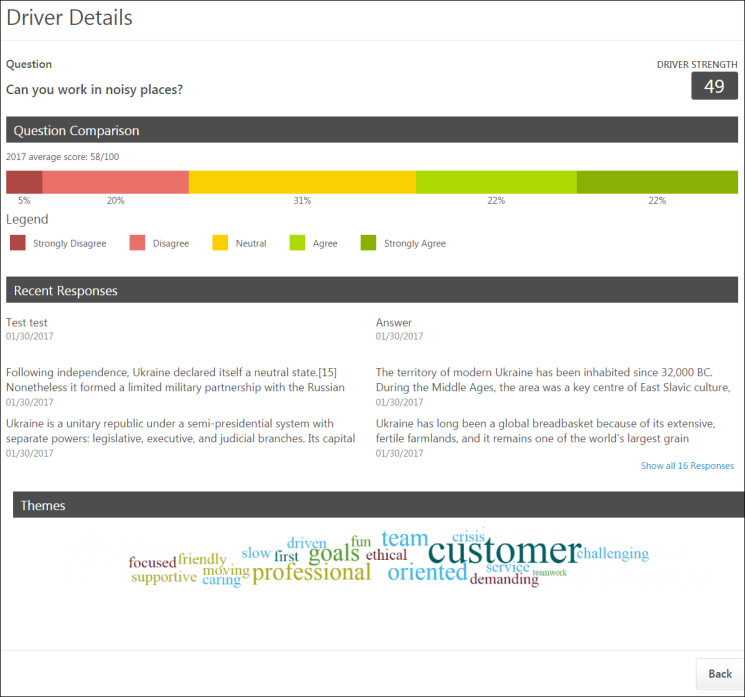
Question
The Question section at the top of the Driver Details page displays the driver question, along with the Driver Strength, which displays to the left of the question. The Driver Strength is used to determine the driver's overall impact on the organization's average satisfaction, engagement, or commitment score.
Question Comparison
The Question Comparison section displays the average question score for the current time period, along with a color-coded chart which graphically represents the response distribution. Each segment of the chart displays the percentage of users who chose each response choice. The response key below the chart indicates which response corresponds with each chart color.
Recent Responses
The Recent Responses section shows six anonymized question responses, organized by most recent. Each response includes the date the response was received. To view more responses, click the page numbers.
Themes
The Themes section displays a word cloud, which displays the top words used in survey responses. The more times a specific word is used in a response to the question, the larger it appears in the word cloud. For example, if the word "customer" is the largest text size, this indicates that "customer" was the word used most often in survey responses. The word cloud filters out connector words like "the," "and," and "a," so that more illustrative response words are not lost in the cloud.
Back
To return to the Engage Dashboard, click the button. See Campaign Dashboard.