Hiring Seasonality - Segments
The Hiring Seasonality segments page displays two different charts:
- Heatmap
- Distribution
In addition to the charts described on this page, each metric's Segments page allows you to view and configure verticals and view metric details. See Benchmark Segments Overview.
To access the Hiring Seasonality segments page, go to and click the Hiring Seasonality report widget.
| PERMISSION NAME | PERMISSION DESCRIPTION | CATEGORY |
| Benchmark Total Access | This permission provides total access to the Benchmark metrics and functionality. | Benchmark - Administration |
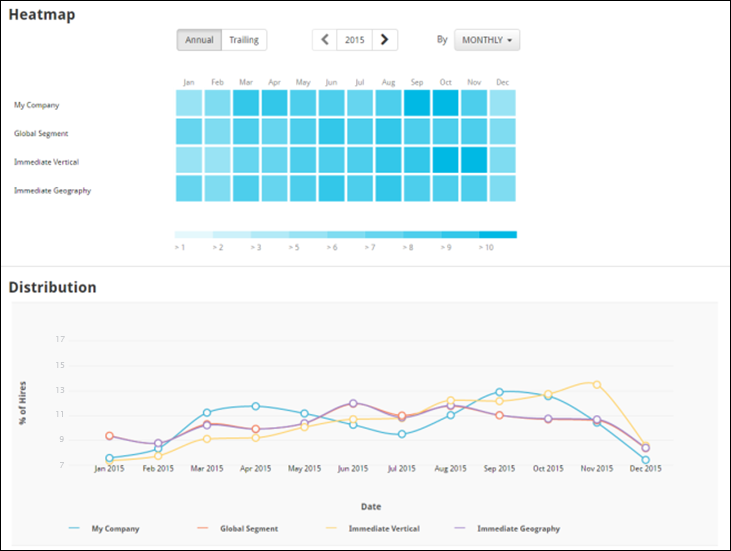
Heatmap
Hiring Seasonality shows the density of hiring activity over the course of a year. The heatmap shows this data over the span of a year with colored tiles. Each tile is the percentage of hires for the specified time span vs. hires for the year. The darker the tile, the more hires for the selected unit of time.
The following filters can be applied to the heatmap:
- Annual/Trailing - Select the associated tab to switch the heatmap data to either annual data or trailing data.
- Year - Use the navigational arrows on either side of the Year filter to see a specific year's hiring seasonality data.
- Timespan - Select an increment of time from the drop-down menu to see hiring seasonality for the year broken down by any of the following:
- Monthly
- Quarterly
Distribution
The Distribution line chart shows the percentage of hires throughout the entire year, for each segment. Each segment is color-coded.